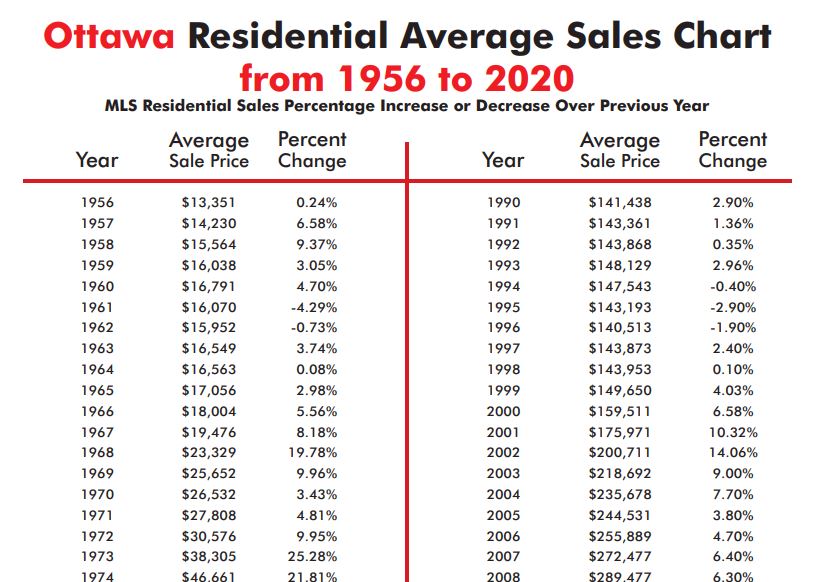
Ottawa Residential & Condo Average Sales Chart – From 1956 to 2020
Interesting figures. Of course remember they are averages and don’t take into account the renewal or decline of a neighbourhood or specific circumstances particular to your house. For those give the Molly & Claude Team a call, we can set up an appointment meet with you, see your property and evaluate each factor according to their specific merit.
[pdf-embedder url=”https://www.claudejobin.com/wp-content/uploads/2021/01/ottawa-residential-average-sales-chart-from-1956-to-2020-presented-by-the-molly-claude-team-realtors-ottawa.pdf” title=”ottawa-residential-average-sales-chart-from-1956-to-2020-presented-by-the-molly-&-claude-team-realtors-ottawa”]
[pdf-embedder url=”https://www.claudejobin.com/wp-content/uploads/2021/01/ottawa-residential-condominium-average-sales-chart-presented-by-the-molly-claude-team-realtors-ottawa.pdf” title=”ottawa-residential-&-condominium-average-sales-chart-presented-by-the-molly-&-claude-team-realtors-ottawa”]

