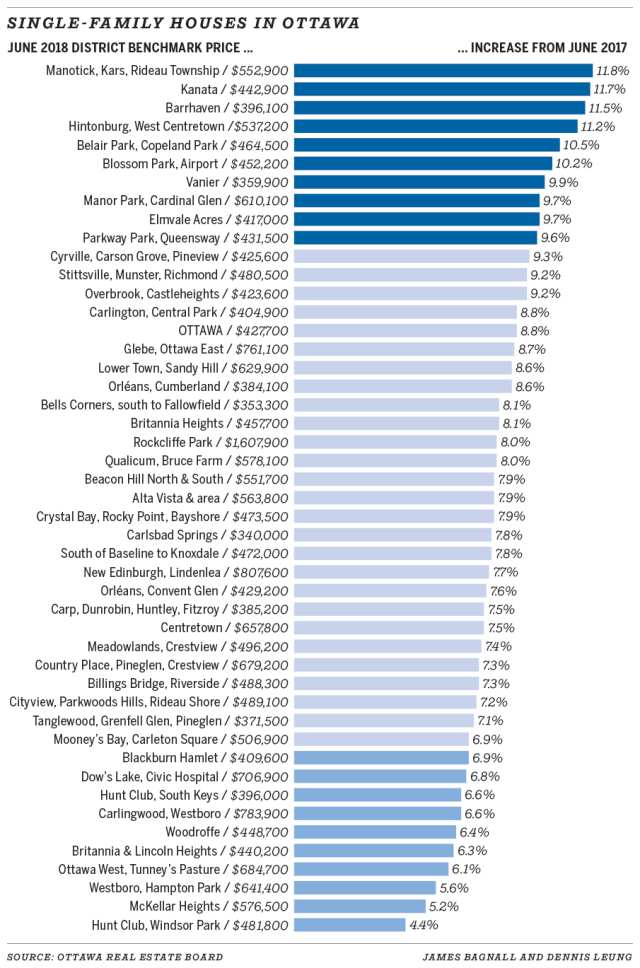
Great chart showing per centage increases for single family homes prices from June 2017 to June 2018 in over 40 areas. Ottawa’s house princes jump and supply remains tight as evidenced in Manotick, Kanata, and Barrhaven areas experiencing large gains principally due to the lack of inventory. Read more here.
